Prometheus系列01-单机版二进制部署
本文最后更新于:January 5, 2021 am
作为 CNCF 中最成功的开源项目之一,Prometheus 已经成为了云原生监控的代名词,被广泛应用在 Kubernetes和OpenShift 等项目中,同时有很多第三方解决方案也会集成 Prometheus。随着 Kubernetes 在容器调度和管理上确定领头羊的地位,Prometheus 也成为Kubernetes容器监控的标配。
考虑到k8s系统的复杂性和上手难度较高,本文将从最简单最基础的部分开始循序渐进,主要介绍如何在CentOS8系统上直接使用二进制文件和systemd进行Prometheus server的单机版本部署,本文只涉及到最基础的Prometheus server、node_exporter和Grafana三个模块,暂未涉及Pushgateway和Alertmanager两个模块。
一般来说,Prometheus server是用于作为服务端来存储各类exporter在被监控节点上面采集的数据,而Grafana则负责将Prometheus server上的数据可视化,因此Prometheus server和Grafana不一定要部署在同一台机器上面,只需要部署两者的机器能够互相通信即可,同理,各类exporter应该部署在需要被监控的节点机器上。这里由于机器数量有限且只作为测试,会将三者都部署在同一台机器上。
Prometheus最初起源于SoundCloud构建的监控系统和告警工具,是Google BorgMon监控系统的开源版本。它基于Go语言且自带时序型数据库,这也就意味着DevOps工程师在部署Prometheus监控系统的时候无需再额外搭建数据库,当然如果有更高的需求也可以自行搭建其他的时序性数据库(TSDB)。
Prometheus的基本原理是通过 HTTP周期性抓取被监控组件的状态,任意组件只要提供对应的 HTTP 接口并且符合 Prometheus 定义的数据格式,就可以接入Prometheus监控。此外,使用Grafana 的Prometheus的数据可视化程度非常高,告警规则也十分多样,还支持传统服务器监控以及云原生监控,可以称为是监控系统中的“瑞士军刀”。

1、部署prometheus
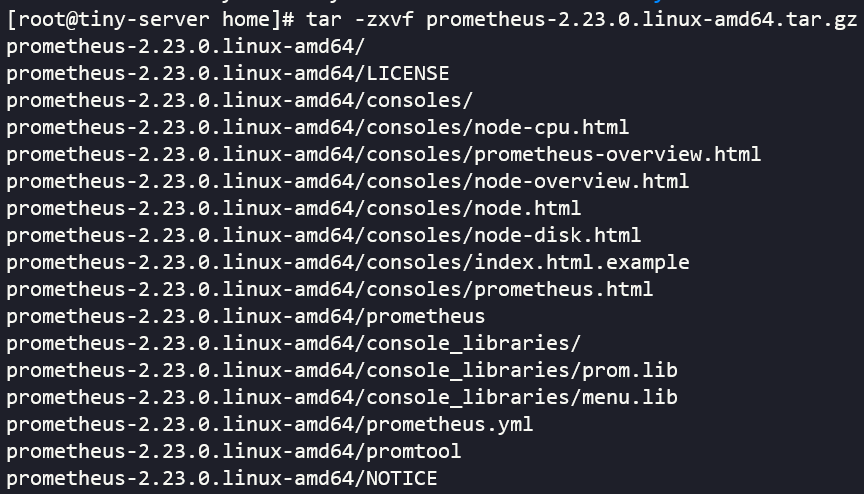
我们去官网选择合适的二进制版本进行下载并解压
1 | |
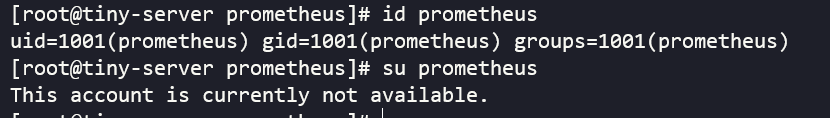
为了方便管理,我们需要创建一个单独的prometheus用户来运行prometheus,同时要保证安全,创建的用户只用来运行prometheus而不能使用shell登录。
1 | |
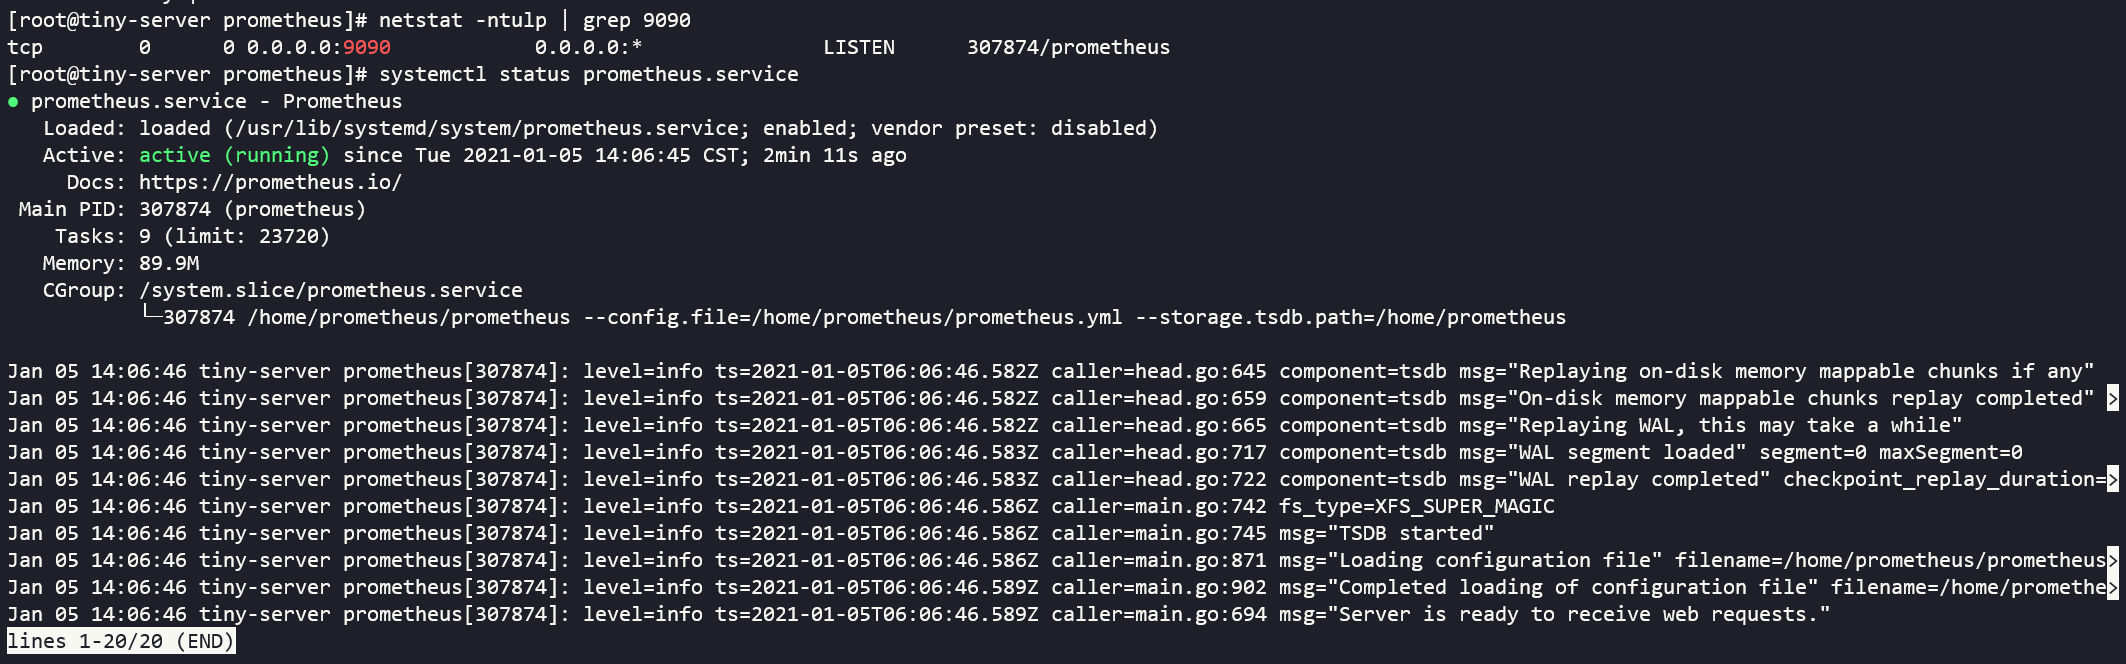
为了方便管理,我们可以配置使用systemd对进程进行管理
1 | |
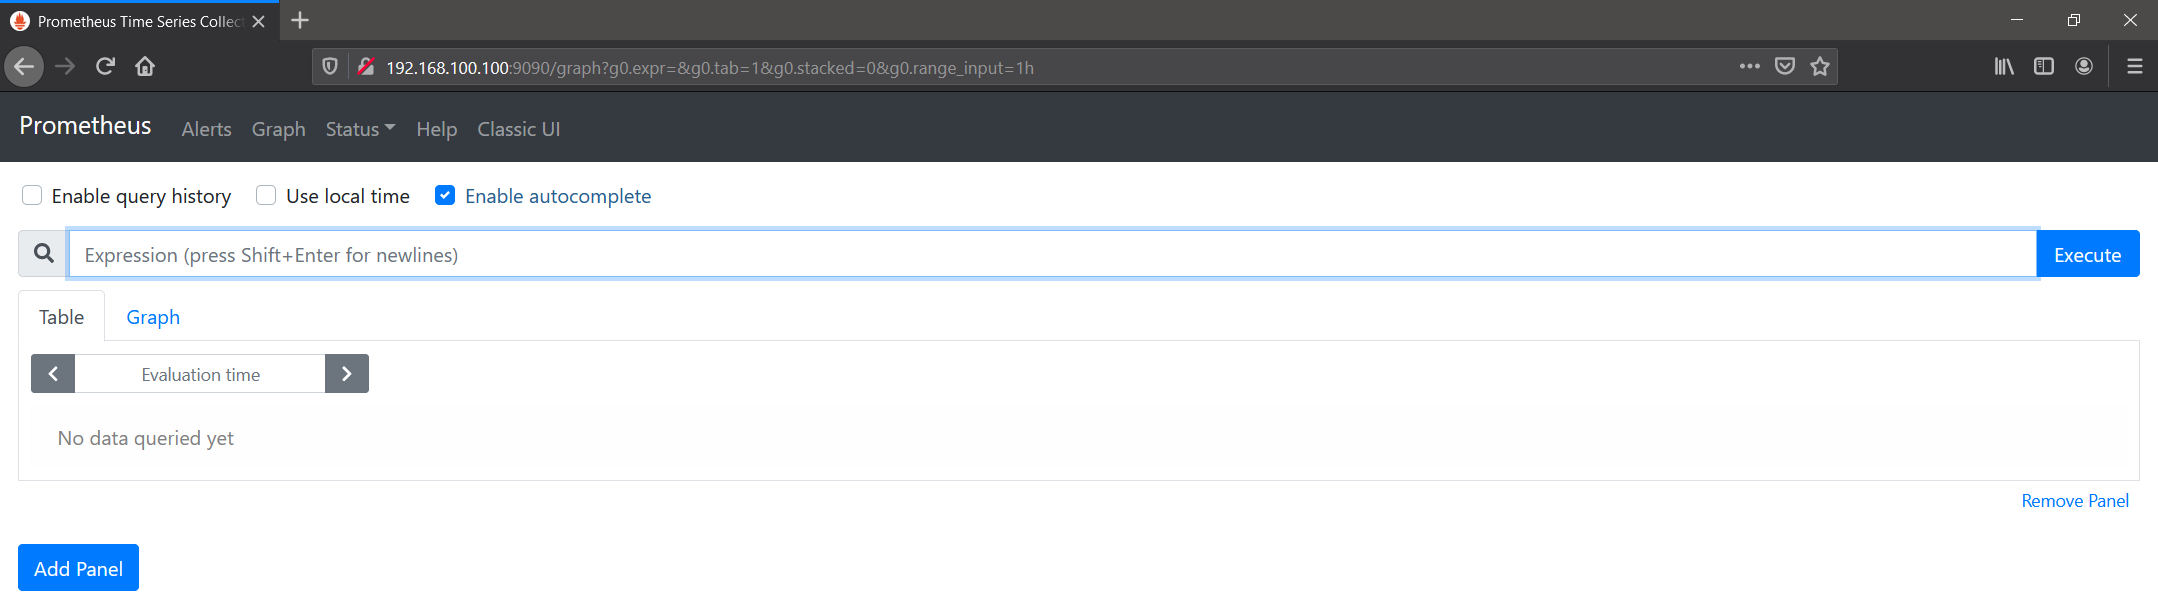
如无意外应该已经可以正常运行了,同时访问服务器的9090端口可以查看到简单的UI界面
2、部署node_exporter
我们去官网选择合适的二进制版本进行下载并解压
1 | |
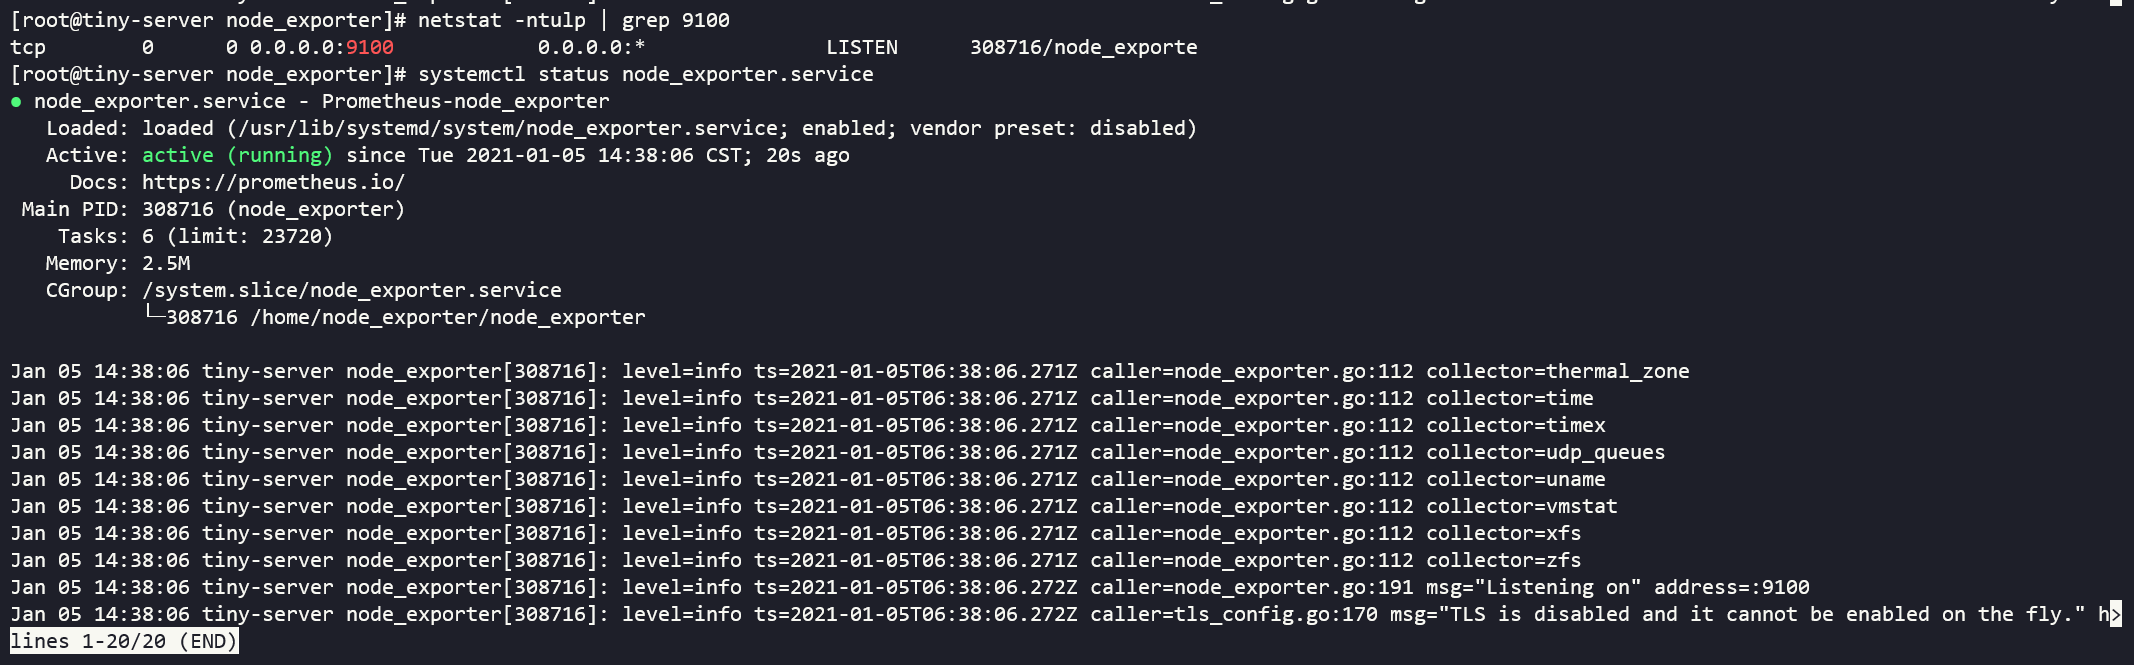
同样的我们使用systemd进行管理
1 | |
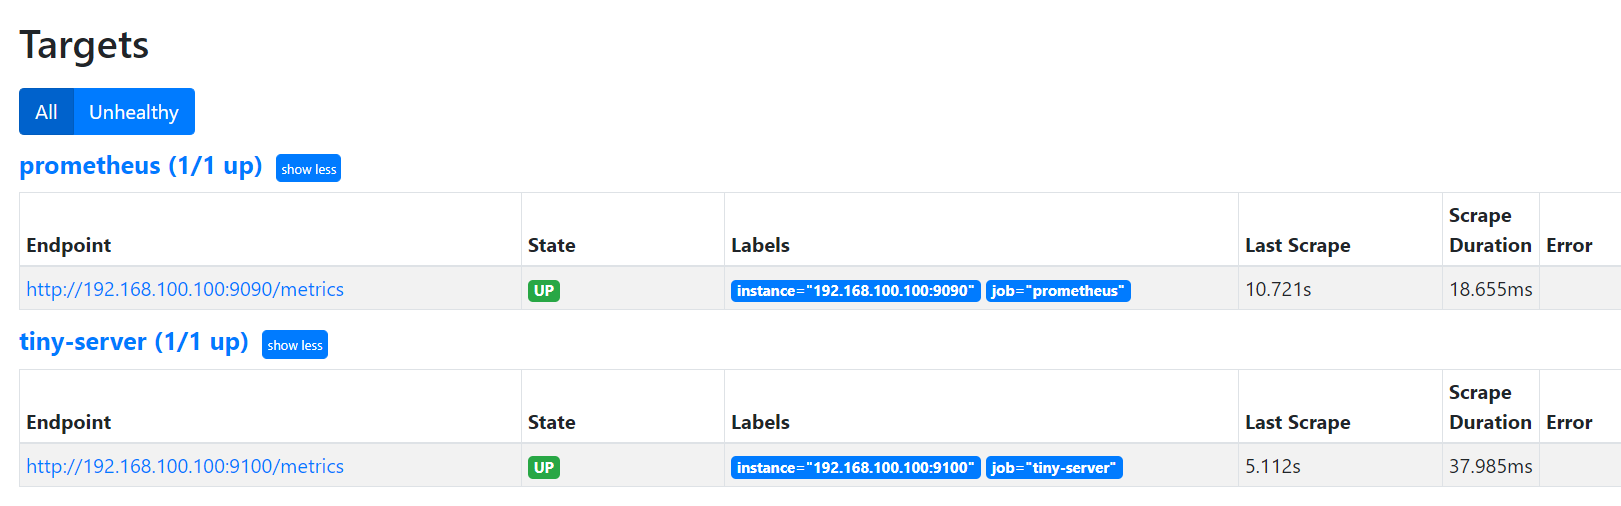
如果顺利的话,node_exporter应该就正常运行在默认的9100端口了,再查看9090端口的prometheus的web页面种的Status里面的Targets应该就能够看到已经运行起来的监控了。
接着我们需要修改Prometheus的配置文件/home/prometheus/prometheus.yml,添加对应的job,使其监听对应IP的9100端口获取信息并重启Prometheus。
1 | |
3、部署grafana
官网给出了多种版本系统的安装教程,我们这里使用的是CentOS,可以直接下载对应的RPM包然后直接安装,对应的操作如下
1 | |
对应的配置文件位于/etc/grafana/grafana.ini,如果有需要可以进行更改,然后重启服务。
默认情况下我们直接访问对应服务器的3000端口,然后使用初始的用户名和密码admin/admin进行登录并且修改初始密码。

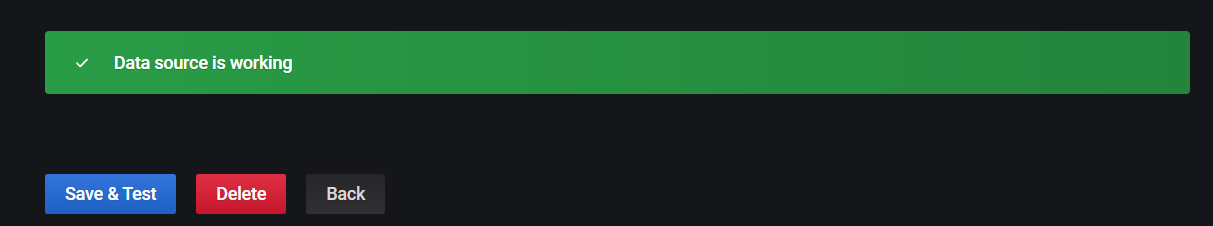
随后我们开始添加数据源


接下来在配置中填入相应的网址和端口即可,一般如果没有进行特殊修改,使用默认的配置即可读取到相应的数据源
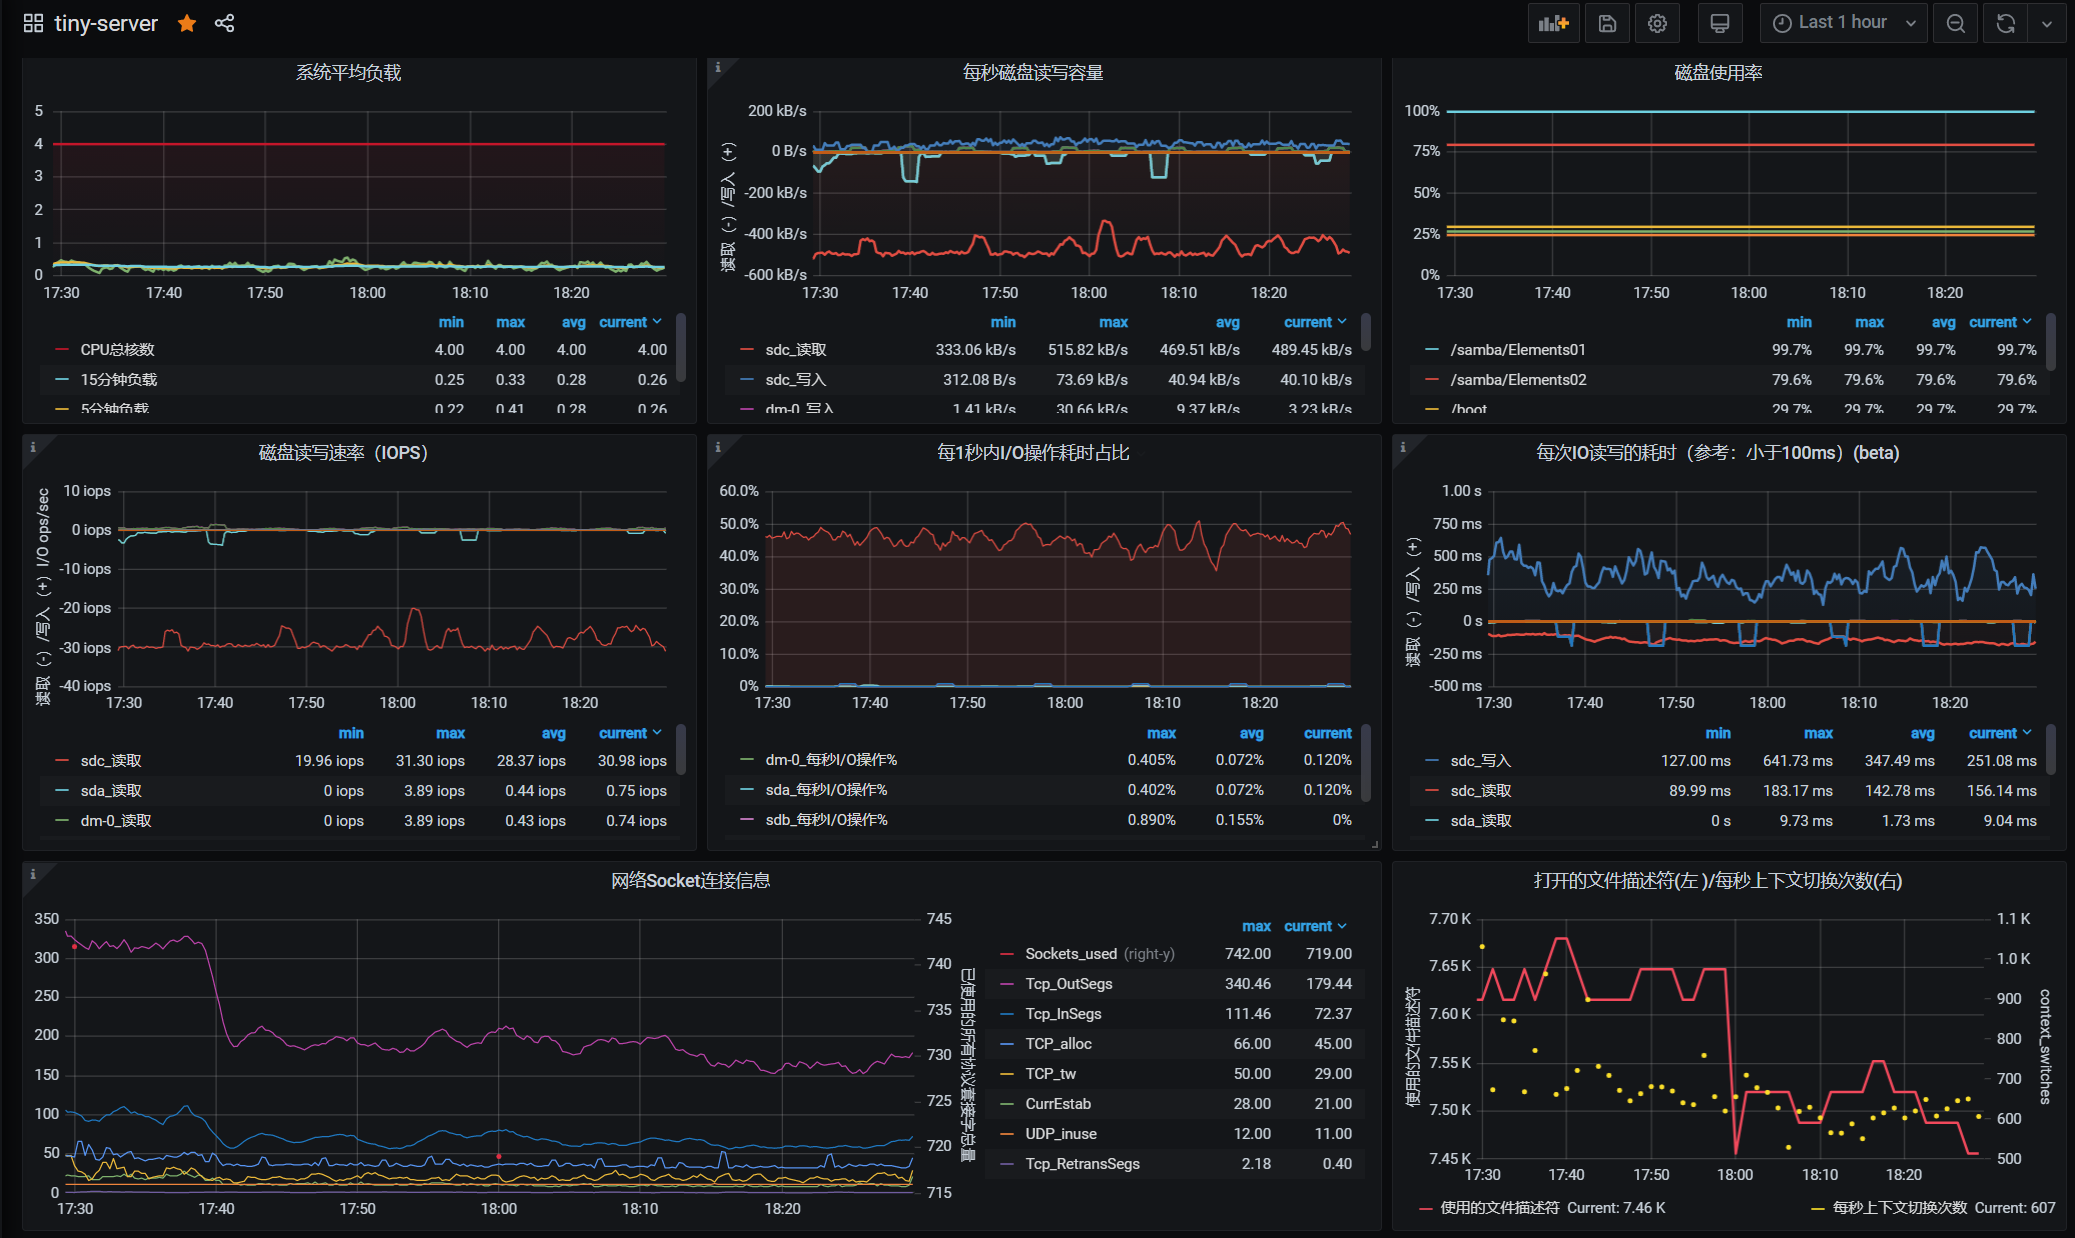
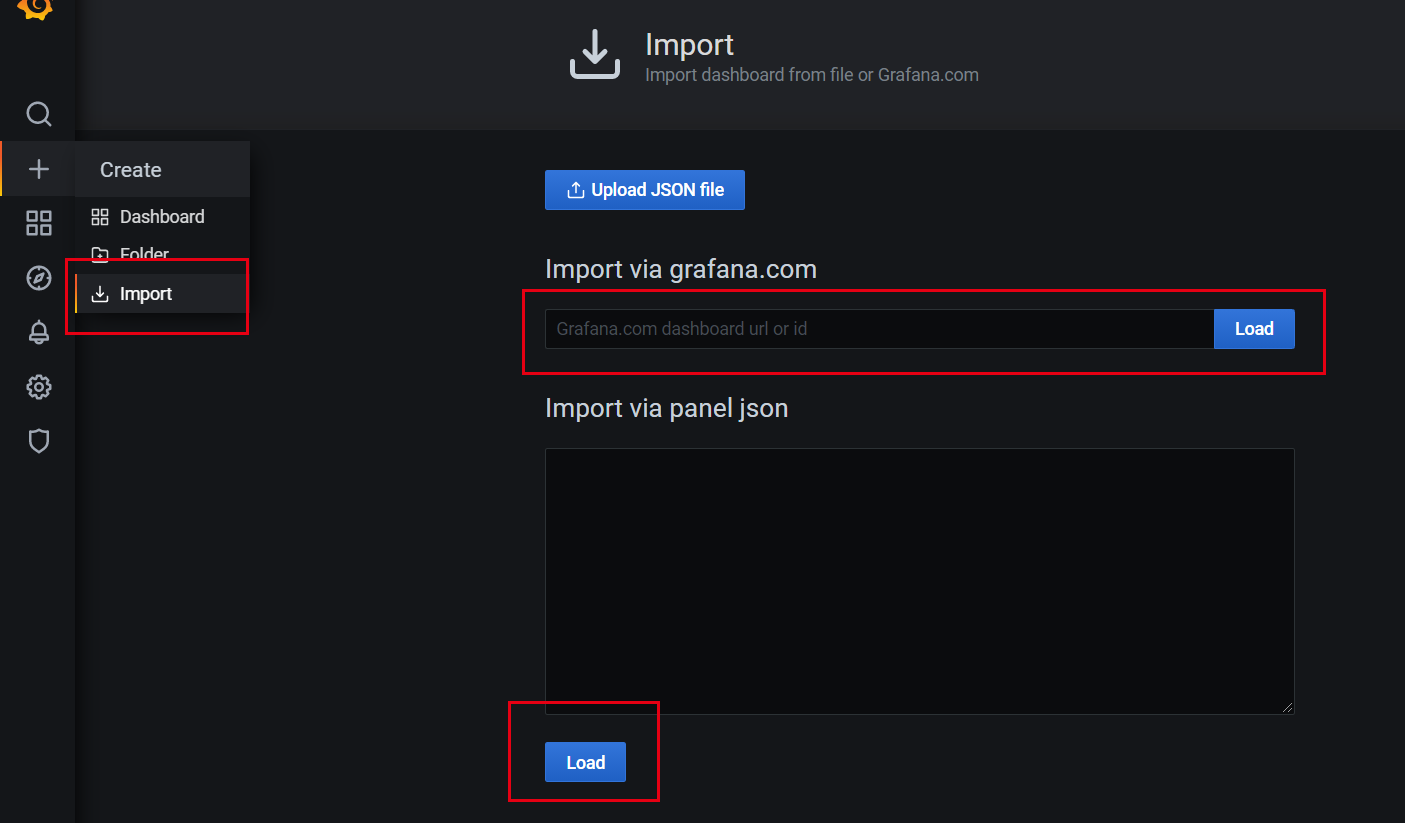
前面我们已经部署了node_exporter,它会采集相应的数据到部署的机器的9100端口,我们这里再到Grafana中添加对应的dashboard就可以看到对应的图表数据了。Grafana官方提供的dashboard非常多,对应node_exporter的可以进行搜索下载,然后再上传到Grafana中,当然如果网络正常的话,我们也可以直接在导入面板中输入对应的ID编号就可以直接导入,由于我们的版本足够新,所以这里我们使用中文版本的node_exporter的dashboard,可以点击这里查看详情。
部分效果展示如下: